
See why your numbers moved
Reporting & Analytics
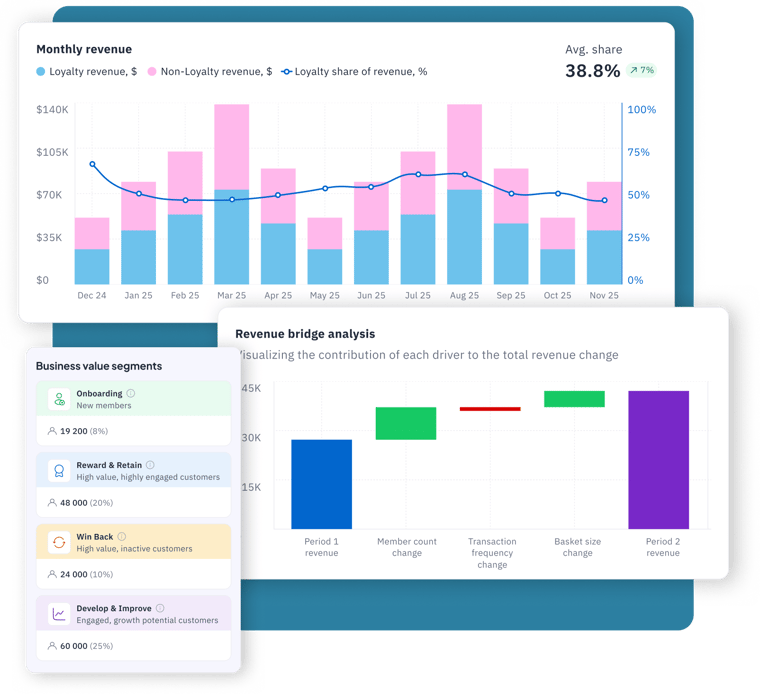
Loyalty revenue went up: more members, more visits, or bigger baskets? ARR dipped: churn, downgrades, or price changes? The Dashboard splits revenue and ARR changes into their drivers.
Revenue and ARR changes, explained
Segments with a clear objective
Reports ready for finance and settlement
Great convenience operators choose Liquid Barcodes




Built to explain, not just report

Changes explained
Revenue and ARR changes are split into their drivers: members, visits, basket size, churn, and price. You see which one moved.

Segments with a job
Members and subscribers are sorted automatically into segments, each with a clear objective. No more sending every campaign to everyone.

Fits your program
Statistics and reports follow what you run: points, cents off per gallon, tiers, car wash and other subscriptions, and the in-app shop.

Easy settlement
Credit subscription revenue to the stores where members actually wash, and pay each store for the coupons it redeems. Straight from standard reports.
REVENUE DRIVERS
Why did loyalty revenue change?
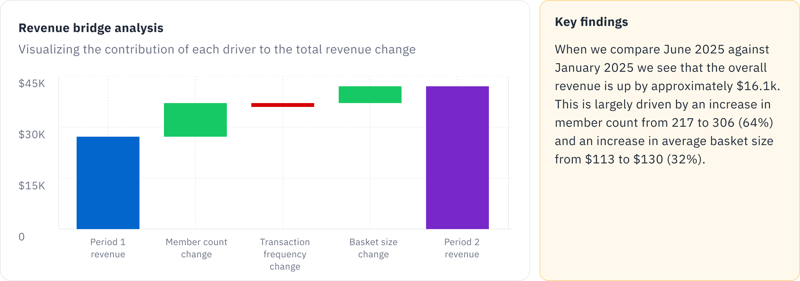
Compare any two periods. Revenue drivers splits the change into active members, visit frequency, and basket size, and the three add up exactly to the total. A plain-language summary names the main drivers.
REVENUE TRENDS
How much revenue comes from members?
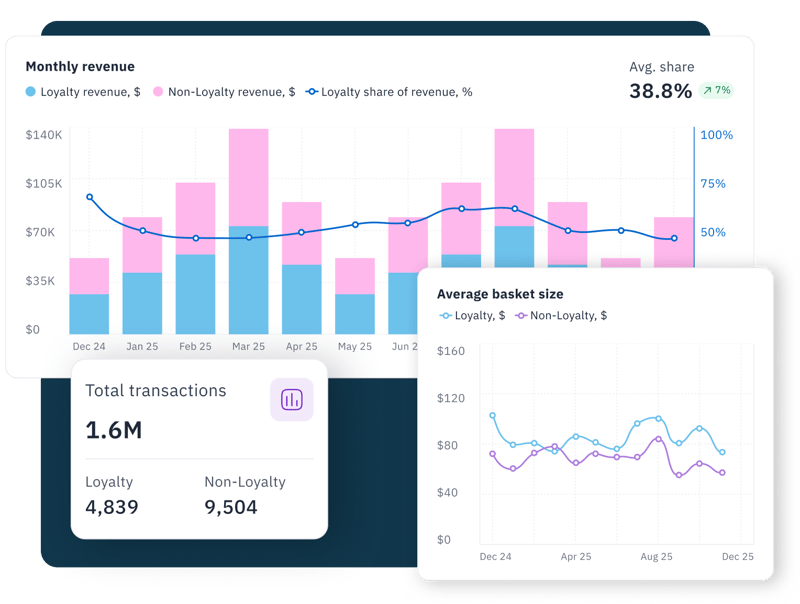
Compare loyalty and non-loyalty revenue, transactions, and basket size by month, quarter, or year. Track loyalty share and how often active members come back. Non-member figures need your POS to send all transactions; most retailers do.
MEMBER TRENDS
Is your active member base growing?
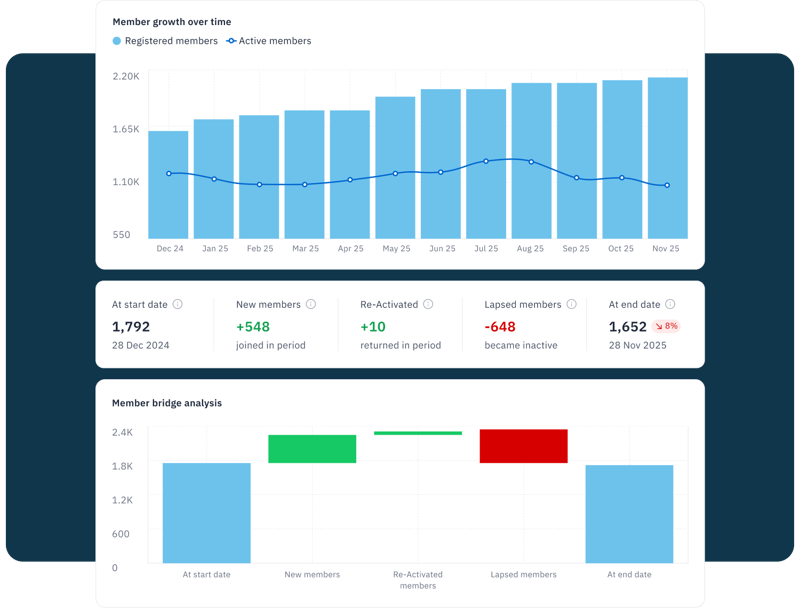
Member trends starts from your active members, adds new and re-activated members, and subtracts the ones you lost. You see why the base grew or shrank, not just the net change.
Stop sending every campaign to every member
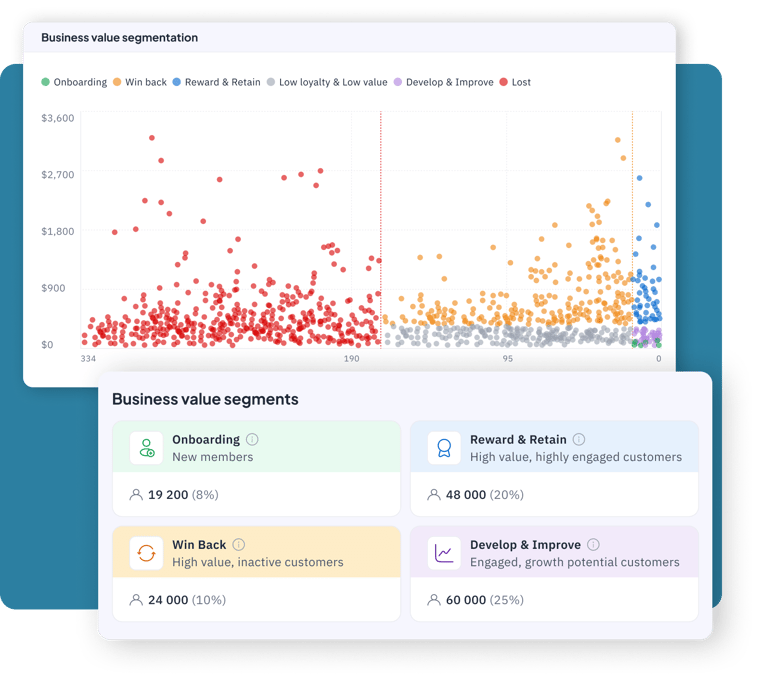
Value based segments
Business Value Segmentation groups every member automatically by recency and spend. Each segment has a clear purpose, so that all your campaigns are targeted and drive the right behavior.
Onboarding your newest members
Reward & Retain your best members
Win Back lapsed high spenders
Develop & Improve active low spenders
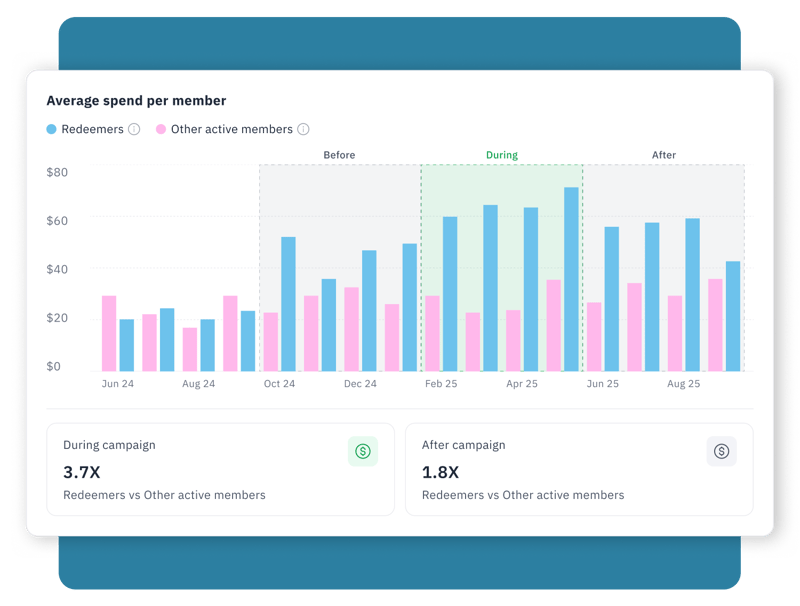
CAMPAIGN IMPACT
How did redeemers shop before and after?
Campaign impact follows the members who redeemed a campaign and compares them with other active members. See spend, basket size, and visit frequency before, during, and after the campaign.
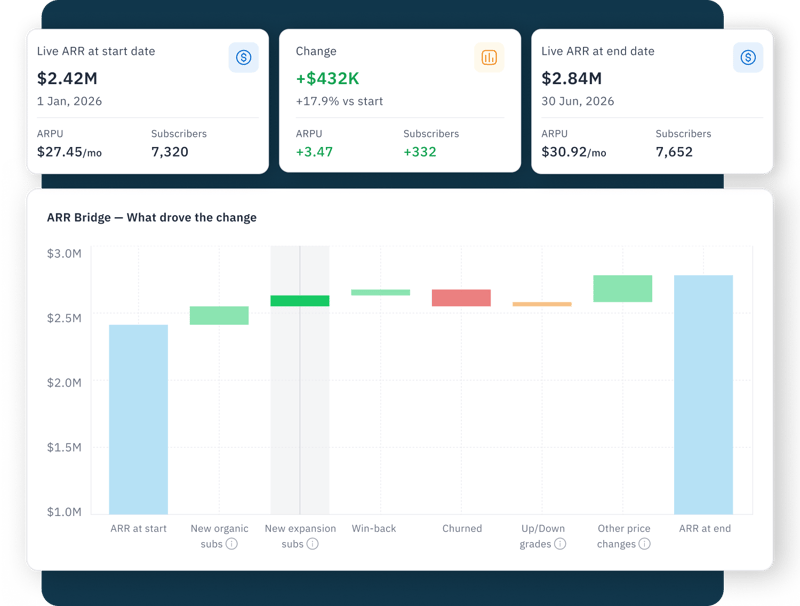
ARR BRIDGE
Why did ARR change?
ARR Bridge walks from ARR at the start of a period to ARR at the end: new subscribers, win-backs, churn, plan upgrades and downgrades, and other price changes. Switch between ARR and MRR.
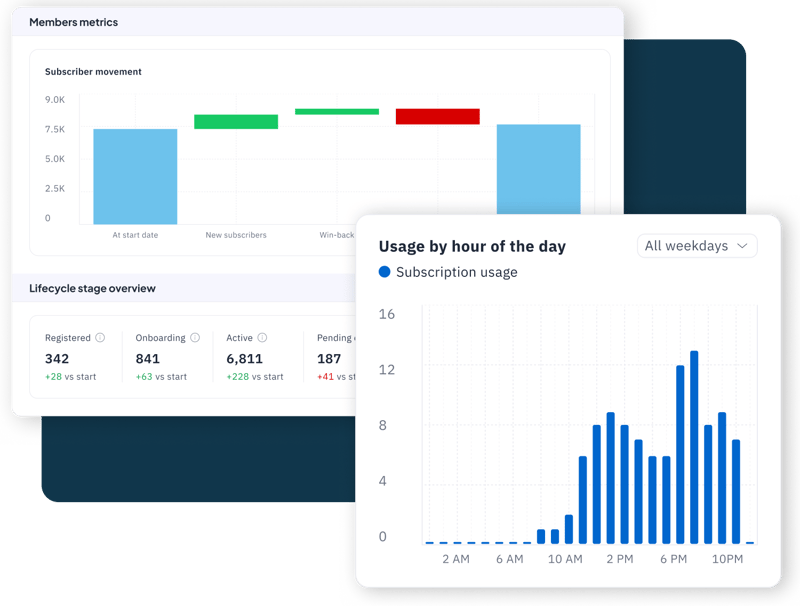
SUBSCRIPTION TRENDS
See when subscribers wash, and how often
Track Live MRR and ARR, active subscribers, renewal rate, and win-backs by plan, store, and region. Usage by hour shows your peak times, so you can move members to quieter hours with push, SMS, and campaigns.
Know which subscribers need what
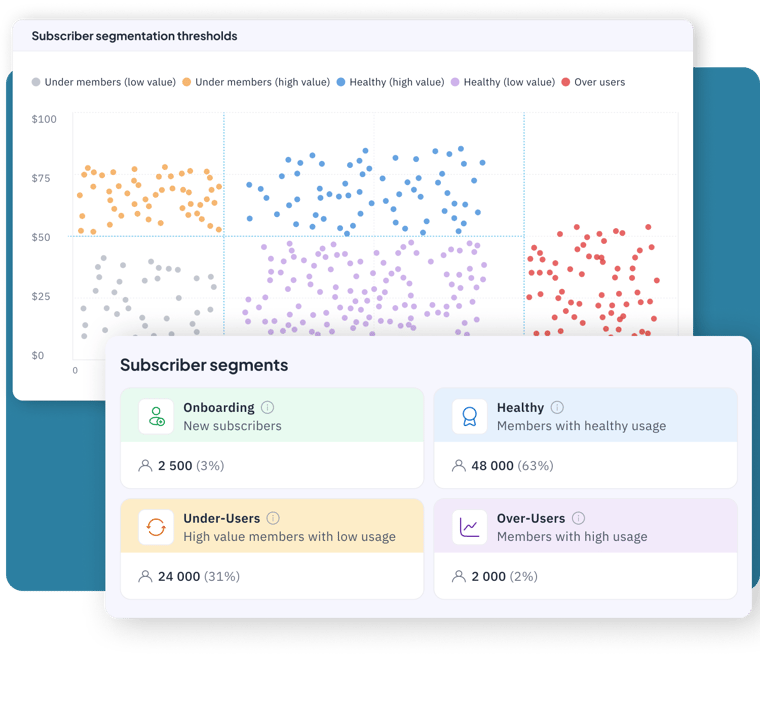
Segments by usage and value
Members & Segments follows every subscriber from onboarding to churn. It splits them by how much they use their plan and what they spend, and tracks conversion and retention by subscriber age.
Onboarding: make a great first impression
Under-Users: drive usage before they cancel
Healthy: sell in-store, not more washes
Over-Users: see what unlimited plans cost
EVERY DAY
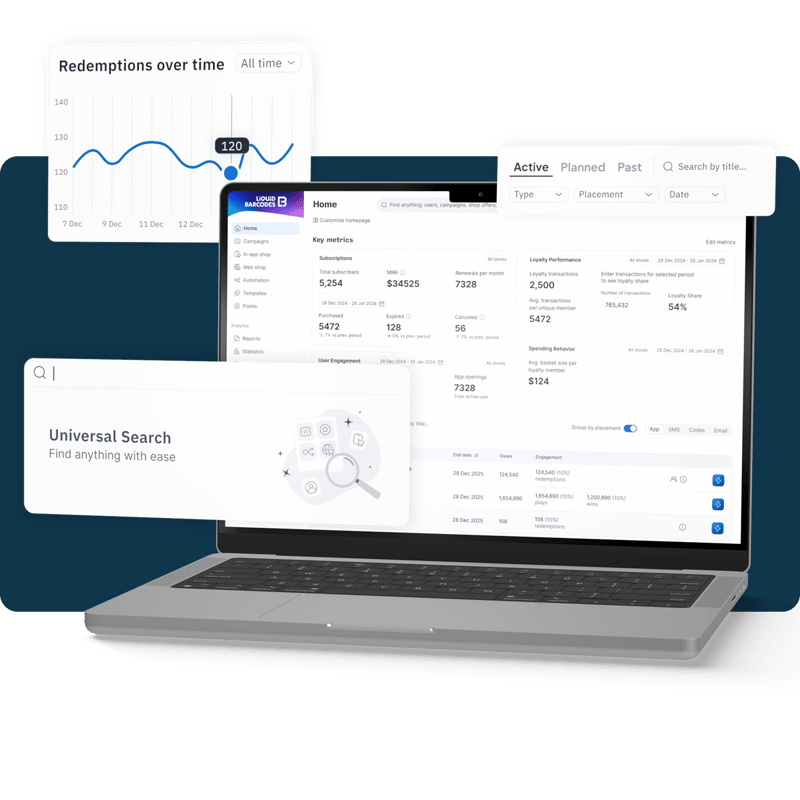
Your program at a glance
Home shows key metrics for members, loyalty share, basket size, and subscriptions, each card with its own store and date filter. Campaign lists show views and engagement for everything that's live.
REPORTS
Reports finance and operations can use
Generate standard CSV reports for campaigns, members, points, subscriptions, the in-app shop, and compliance. See every column and its definition first. Members appear as anonymous references by default, not names or phone numbers.

Know what's working, and why
See it with your own programs
We'll walk you through the statistics and reports for the programs you run: loyalty, points, fuel, and subscriptions.
Why revenue and ARR moved
Who to target, segment by segment
Reports ready for settlement